Our Michigan Avenue
Research Project
Overview
The Our Michigan Avenue website is a space created for the Greater Lansing community. This website focuses on the hundreds of millions of dollars used for development projects within the community area.
As students of Michigan State University, studying UX design, research, and testing methods, we were assigned a research project over the course of a semester of three months. My team and I had an end goal of enhancing the community’s engagement with the website and encouraging members to use the public platform to become further educated on development projects in the area while having the option of voicing their opinions and asking questions using the website.
Role: UX Researcher & UI Designer
Team: Elizabeth Ly, Mika Byar, Phoebe Peterson, Sophie Furlong
Duration: October 2019 – December 2019
Brief: Civic Technology Research Project
Location: Michigan State University and on-site reach in The Greater Lansing Area (Lansing, MI)
Understanding the Problem
Many large-scale development projects fly right under the average Citizen’s radar. This problem is why UX Students were assigned to complete further research on why this is happening and how the Our Michigan Avenue website can help solve this problem.
My team and I were assigned to specifically focus on tax increment financing funds, otherwise known as TIFs. To begin our research as a team, we had to fully understand what TIFFs are and how they affect the community. We interviewed with a local Lansing reporter and community leader and attended two Lansing community board meetings. As our understanding of TIFs heightened, we started our user research on-site with community members at community events.
Setting the Goal
To create a new website feature that will provide The Greater Lansing community members the information they need to properly educate themselves on TIFs and the TIF projects happening in their area. Through UX research, my team and I would figure out what would need to be included in this feature to reach our goal successfully.
Design Thinking Process
This diagram is an overview of our team’s design thinking process and the steps within each area of design thinking.
Empathize
Understanding the needs of the community
Steps:
1. Interview experts 2. Survey the community 3. Analyze results & synthesize information
Define
Defining the goal to meet the needs of the user
Steps:
1. Iterate data that suggests the user's needs 2. Create problem statement
Ideate
Generating design ideas to solve the problem
Steps:
1. Brainstorm and narrow in on 3 ideas 2. Fine tune ideas into tangible low-fidelity wireframes
Prototype
Creating a visual design eligible for testing
Steps:
1. Revise low-fidelity wireframes 2. Present to local audience for feedback 3. Analyze feedback & create high-fidelity wireframes
Testing
Test existing wireframes & apply findings
Steps:
1. 3-6 designers/developers for cognitive walkthroughs 2. Identify target audience 3. Test individual wireframe screens 4. Generate user scenarios 5. Apply findings
Empathize: Personas
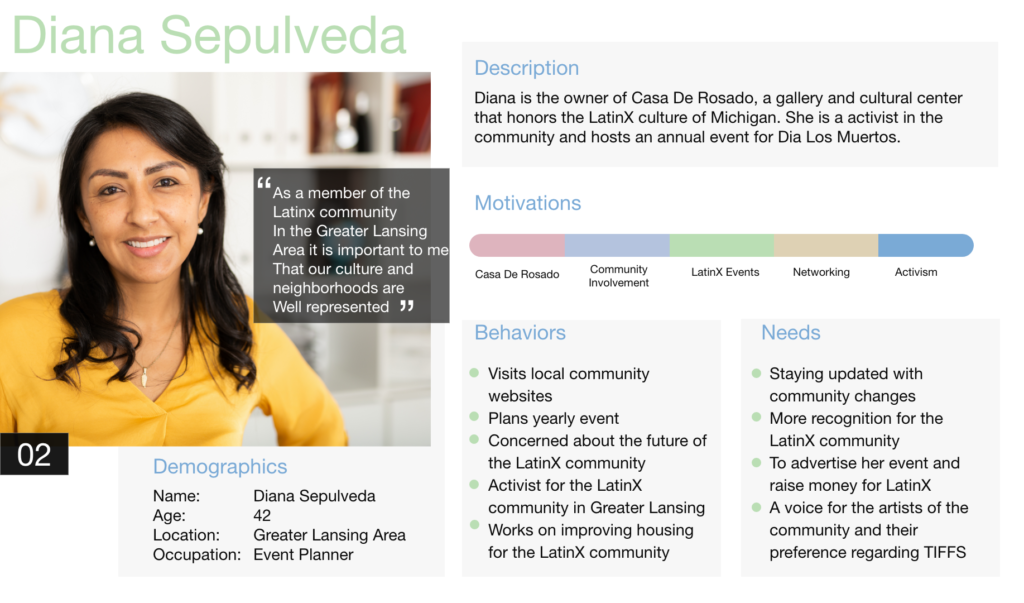
To better understand the needs of the community members, my team and I generated user personas drawing from our qualitative research conducted in the first stage of the design thinking process. Then, using strategies such as empathy mapping, we cultivated personas that matched the types of people in the community.
The visual aspect of these personas helped us better understand the types of users engaging with our product. In addition, a deeper understanding of the community members allowed us to generate conclusions on their wants and needs, which helped us create a more successful outcome.

Define: Field Study
My team and I made it a point to do on-site user research to observe the community members. We decided to attend a community event for Casa de Rosado’s Day of the Dead event in Lansing, MI. 2019
Our team was assigned two target audiences, the first being the LatinX community and the second being the artists in the area.
Objective
To observe and analyze the specific behavior of participants at Casa de Rosado to discover user's needs for the OMA website.
Questions
How does the community prefer to be presented with information (internet, social media, newspaper)?Does the LatinX community feel connected with Greater Lansing?
Findings
Facebook is preferred platform for communication. Community looks for information from reliable sources/sites. The artist community struggles with representation.
Improving OMA
Create a Facebook group that is accessible from the OMA website. Establish credibility by citing sources. Connect with local businesses and artists of the community.
Gathering Insights
Based on the UX process, it was clear that experts of the community thought the most critical aspect of this feature would be explaining the costs of TIFs and where the city generates the money for them. The community survey showed that the majority of community members had zero knowledge of what a TIF was.
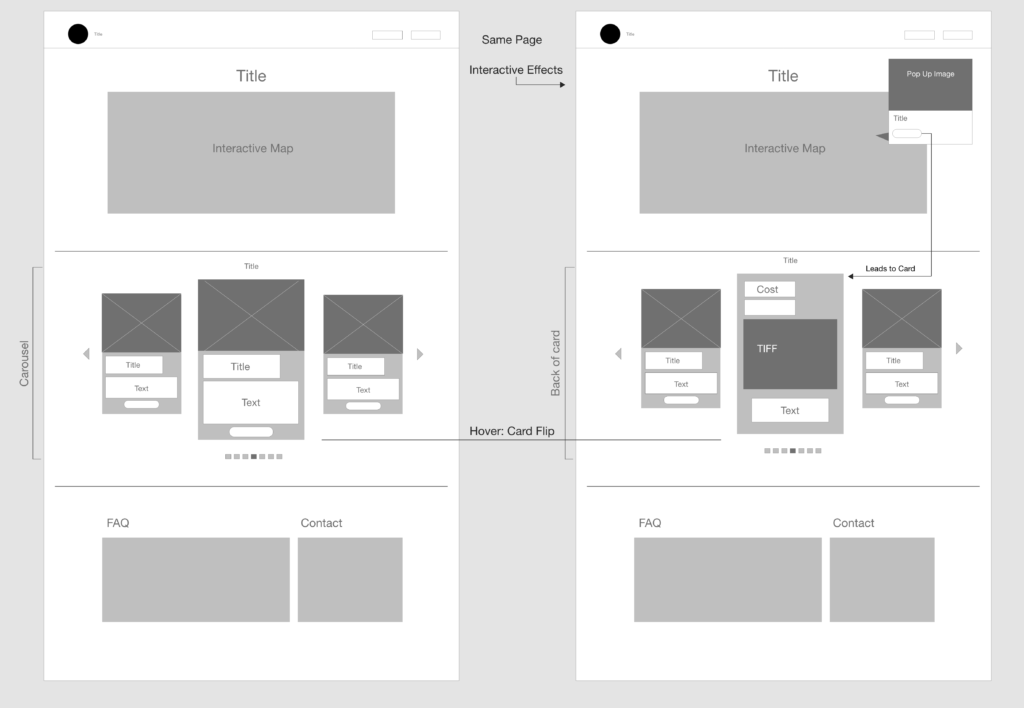
Ideate: Low-Fidelity Wireframes
Key takeaways
- Include a section that explains how TIFFs affect the community and taxpayers (FAQ).
- Include the cost of TIFFs in the area.
- Include a section of current and past TIFF infrastructure projects.
Prototype : Low-Fidelity Wireframes
After creating three low-fidelity prototypes and fine-tuning them, we concluded the wireframes we wanted to present for our final product. (Prototype #3)
Testing: Cognitive Walkthroughs
In summary, we found that all city council and community members that participated in our fieldwork agreed that Prototype 3 would be the most beneficial to the OMA website. Participants thought that educating and putting emphasis on the costs of TIFFs would be most helpful. They also suggested that we include a FAQ in Prototype 3 because many community members have questions regarding TIFFs. Moreover, we applied these results to our final prototype to create a feature that will educate with text and provide visual representation regarding TIFFs in the Greater Lansing area.
Final Design: High-Fidelity Wireframes
After making changes based on our findings from the cognitive walkthroughs, we created our high-fidelity wireframes. Our high-fidelity mockup of the final product was created with Adobe XD.
